![[ProSizer screenshot]](psize1.gif)
ProSizer is an Excel tool designed to give a trader a powerful technique for magnifying equity growth and controlling drawdowns. (See the screenshots below.)
At the most basic level, every trader should have a trading system, or strategy, that:
Many traders don't take that last point seriously enough. They concentrate heavily on the actual entry and exit strategy, and then perform a crude position sizing technique such as trading 1 contract for every $10,000 in equity or something similar.
We all know that individual trades have different outcomes, consisting of profits that result from the entry/exit strategy and losses that result from stops. A history of closed-out trades contains all the information needed to analyze the system's performance and develop a position sizing algorithm. We can calculate the equity after each trade, as well drawdown, peak equity, maximum drawdown, net profit, return on equity, expectancy score, etc.
But how do we answer the question, "how many contracts to trade?"
Well, we know that the history of trades will not repeat. However, if the strategy hasn't been "curve fitted" we can assume that the future will yield a series of trades with similar characteristics in terms of profit, loss, percent profitable, and so on. In other words, if we have confidence in the robustness of our strategy we can be confident that a future series of trades will be statistically similar to past history.
ProSizer analyzes the theoretical future outcomes by randomly scrambling the trade history thousands of times, applying a position sizing model, and gathering statistics on the results. This is an application of a technique known as Monte Carlo simulation.
See the ProSizer Documentation for details on position sizing strategies and how the program works.
This first screenshot shows the primary working sheet in ProSizer. Here it displays statistics for 5000 Monte Carlo iterations of a strategy. The position sizing model is shown in the dialog box on the left: a combination of percent of equity risked and percent of equity allocated to volatility, using the inputs in the two yellow cells above labeled "risk % of equity" and "volatility % of equity."
The input data consists of the first 3 columns: profit, initial stoploss, and volatility. Tradestation can output these values by calling my _SystemHistory function from within your strategy's signal. See the EasyLanguage page for more EasyLanguage functions.
![[ProSizer screenshot]](psize1.gif)
The table of statistics is more important than the plots below it. The plots show the histograms and cumulative probabilities of return, max drawdown, and return/maxdrawdown ratio. The blue lines indicate the mean, the magenta lines indicate the median, and the green lines indicate standard deviations. Drawdown has a lognormal distribution which explains the uneven spacing of standard deviations.
One easy way to develop an optimum non-combination position sizing strategy is to select just one model in the dialog box. Then choose a drawdown you can live with, such as 20%. Set the number of Monte Carlo iterations to something small like 100. Then simply adjust the input parameter for that position sizing model until the mean maximum drawdown is 20%. Repeat for other individual position sizing models. Trade using the model that gives you the highest return/drawdown ratio for your 20% drawdown. You may be surprised at the result; the best strategy may not be how you're trading now.
This next screenshot shows a 2-D color surface map, showing the performance on a combination of two strategies in a section of the 2-dimensional parameter space. Often, if you have found the two best performing models from the Data worksheet as described above, you can squeeze out extra performance by combining them here. You want to find the cell that meets these criteria:
![[ProSizer screenshot]](psize2.gif)
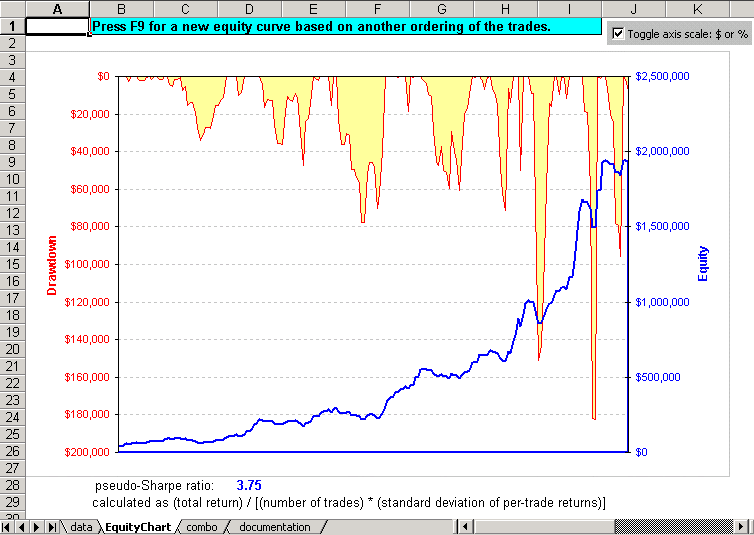
At any time, you may look at an equity curve that results from your position sizing strategy. The equity curve shown here represents a single-sequence scrambled order of trades such as that shown on the first worksheet. By checking the "Don't scramble" box on the first worksheet you can view the equity curve for the original ordering of trades:

Copyright © 2004 by Unicorn Research Corporation
All rights reserved.